
Why Investors Should Track Rent per Square Foot | UK Property
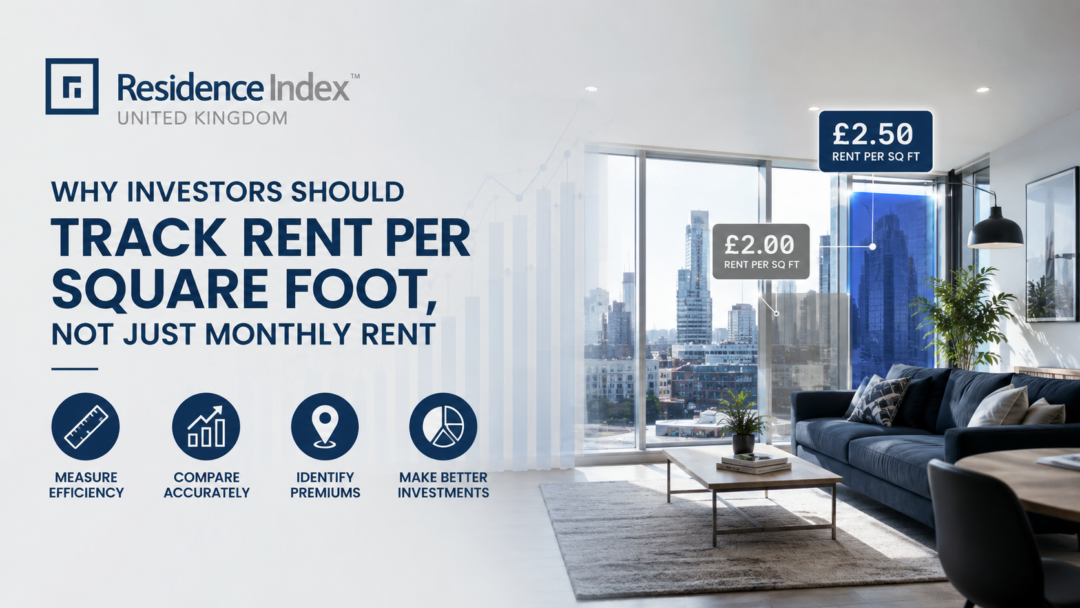
Why Investors Should Track Rent per Square Foot, Not Just Monthly Rent
When investors compare rental properties, one number usually gets most of the attention:
Monthly rent.
A flat renting for £1,800 per month appears stronger than one renting for £1,500.
But what if the first property is 900 sq ft and the second is only 600 sq ft?
Suddenly, the comparison looks very different.
The larger property generates £2.00 per sq ft per month, while the smaller property generates £2.50 per sq ft.
That is why serious investors should track rent per square foot, not simply the headline monthly rent.
It provides another way to understand how efficiently a property converts space into rental income — and can reveal differences that headline rents hide.
What Is Rent per Square Foot?
Rent per square foot measures the rent generated relative to the size of a property.
The basic calculation is:
Monthly rent ÷ internal floor area = monthly rent per sq ft
For example:
Property A
- Monthly rent: £1,800
- Size: 900 sq ft
- Rent per sq ft: £2.00
Property B
- Monthly rent: £1,500
- Size: 600 sq ft
- Rent per sq ft: £2.50
Property A generates £300 more rent every month.
However, Property B generates 25% more rent for every square foot of accommodation.
That does not automatically make Property B the better investment. But it tells you something that monthly rent alone cannot.
Monthly Rent Can Create Misleading Comparisons
A £2,000 monthly rent sounds better than £1,600.
Yet investors need to ask what is required to generate that additional £400.
Is the property:
- 40% larger?
- Significantly more expensive?
- More expensive to furnish?
- Carrying a higher service charge?
- Harder to maintain?
- Occupying a substantially better location?
Without normalising the figures, headline rent can encourage investors to compare fundamentally different assets.
This is similar to the problem with headline yield. As we explained in Why Yield Is the Most Misunderstood Metric in UK Property Investment, one attractive number rarely tells the entire investment story.
Rent per square foot gives investors another layer of information.
Why Rent per Square Foot Matters
Imagine two apartments in the same Manchester neighbourhood.
One is a spacious older two-bedroom apartment.
The other is a smaller, modern apartment with an efficient layout, strong specification and attractive communal amenities.
The larger apartment may achieve the higher monthly rent.
But the smaller apartment could command considerably more rent per square foot.
Why?
Because tenants do not value every square foot equally.
They value usable space.
A well-designed 650 sq ft apartment can sometimes feel more practical than an inefficient 800 sq ft apartment containing oversized corridors, awkward corners or poorly proportioned rooms.
For investors, that distinction matters.
Smaller Does Not Automatically Mean Worse
Investors sometimes assume more square footage equals greater value.
That can be true, particularly for families or tenants who prioritise space.
But urban rental markets operate differently.
Young professionals may place greater value on:
- Location
- Transport connectivity
- Natural light
- Storage
- Building amenities
- Interior specification
- Energy efficiency
- Workspace
- Layout efficiency
This helps explain why modern apartments in desirable city-centre locations can command significant rental premiums despite relatively compact floorplans.
Our analysis of Manchester’s rental market highlights why investors increasingly need to select the right asset within a strong city rather than assuming every property benefits equally from city-wide demand.
Rent per Square Foot Helps Reveal Tenant Willingness to Pay
One particularly useful interpretation of rent per square foot is tenant willingness to pay for a particular type of space.
Suppose comparable apartments nearby typically achieve £2.20 per sq ft.
A particular development consistently achieves £2.60.
The investor should investigate why.
Perhaps tenants are paying premiums for:
- Better amenities
- Superior management
- A stronger location
- Higher specification
- Better views
- More efficient layouts
- Proximity to employment
- Limited competing supply
That premium can tell investors something about the competitive position of the property.
But it should never be assumed to continue automatically.
The investor still needs to establish whether the premium is structural or temporary.
Use It to Compare Similar Properties
Rent per square foot becomes particularly useful when comparing units within the same development or immediate submarket.
Consider three hypothetical apartments:
Property | Size | Monthly Rent | Rent per Sq Ft |
One-bed A | 500 sq ft | £1,250 | £2.50 |
One-bed B | 600 sq ft | £1,380 | £2.30 |
Two-bed C | 800 sq ft | £1,680 | £2.10 |
The two-bedroom apartment produces the highest headline rent.
But the smaller one-bedroom produces the most rental income relative to its floor area.
Now the investor can ask a much more useful question:
Why?
That question can reveal where tenant demand is deepest and which unit types command the strongest rental premium.
Rent per Square Foot Can Highlight Layout Efficiency
Floor area alone tells you how much space exists.
It does not tell you how effectively that space is used.
Two apartments measuring 700 sq ft can provide completely different living experiences.
One might have:
- Large corridors
- Poor storage
- Awkward room shapes
- Limited natural light
- Oversized entrance areas
The other could use almost every square foot effectively.
This is why investors should examine floorplans alongside rental comparables.
Efficient design can potentially support stronger tenant appeal without requiring a larger property.
This connects closely with the wider principle discussed in Why Some Rentals Never Sit Empty: tenants increasingly assess the complete living proposition rather than simply choosing the cheapest available space.
Track the Metric Over Time
Rent per square foot becomes even more useful when tracked rather than viewed once.
Suppose an apartment moves from:
£2.20 → £2.30 → £2.45 → £2.55 per sq ft
over several letting cycles.
That provides evidence of improving rental pricing power.
Investors can then compare that growth with:
- Local competing developments
- Similar unit types
- Inflation
- Overall city rental growth
- Changes in local supply
The Office for National Statistics private rental data provides an important macro benchmark. Average UK private rent reached £1,388 per month in June 2026, 3.3% higher than a year earlier.
However, national and regional averages cannot tell investors how efficiently an individual apartment is monetising its floor space.
That requires asset-level analysis.
Compare Purchase Price per Square Foot Too
Rent per square foot becomes particularly interesting when compared with purchase price per square foot.
Suppose two apartments are available:
Apartment A
- Purchase price: £300,000
- Size: 600 sq ft
- Price per sq ft: £500
- Rent: £1,500
- Rent per sq ft: £2.50
Apartment B
- Purchase price: £360,000
- Size: 800 sq ft
- Price per sq ft: £450
- Rent: £1,700
- Rent per sq ft: £2.13
Apartment B looks cheaper on a capital-value-per-square-foot basis.
But Apartment A monetises its space more efficiently.
Neither number provides the answer independently.
Together, they create a much stronger framework for comparison.
Do Not Use Rent per Square Foot in Isolation
There is an important warning.
Higher rent per square foot does not automatically mean better investment.
A tiny studio may produce extremely high rent per square foot but have:
- A narrower tenant market
- Greater turnover
- Limited resale demand
- Higher competition
- Less flexibility
- A disproportionately high service charge
Meanwhile, a larger two-bedroom apartment could generate lower rent per square foot while offering broader tenant demand and stronger resale liquidity.
The objective is not to maximise a single metric.
It is to understand what each metric tells you.
That is also why yield chasing can cost property investors money. Optimising one number without considering the wider investment can create the wrong portfolio decision.
Build a Better Property Comparison Sheet
When comparing potential investments, investors should consider recording:
- Purchase price
- Internal floor area
- Price per square foot
- Expected monthly rent
- Rent per square foot
- Gross yield
- Estimated net yield
- Service charge
- Rent per bedroom
- Comparable local rents
- Expected void allowance
- Tenant profile
This produces a much richer comparison than simply looking at:
Price + monthly rent + headline yield.
Investors can apply this framework when comparing opportunities across the Residence Index UK property portfolio, including developments in Manchester, Birmingham, Liverpool and other key UK markets.
Use External Market Data as Context, Not the Answer
No individual metric should replace proper local due diligence.
Investors should combine property-level analysis with broader market evidence.
The ONS private rental statistics provide official data on rental movements across the UK.
Institutional research from Savills can provide additional context around residential investment and rental-market conditions, while JLL research can help investors understand wider living-sector, development and urban-market trends.
These sources help establish the wider environment.
But investors should still examine individual comparable properties before accepting any projected rent.
The Better Question
Instead of asking:
“How much rent does this apartment achieve?”
Ask:
“How much rent does it achieve relative to the space I am buying?”
Then go further:
“Why are tenants willing to pay that amount per square foot?”
That second question is where the real investment analysis begins.
If the answer is strong location, efficient design, limited supply, quality amenities and durable tenant demand, the rental premium may be defensible.
If the answer is simply an optimistic developer forecast, further due diligence is required.
Final Thought
Monthly rent tells you how much money comes in.
Rent per square foot tells you something about how efficiently the asset generates it.
Neither should be viewed alone.
The strongest property analysis combines rent per square foot with purchase price, yield, operating costs, tenant demand, layout, location and exit liquidity.
Because professional property investing is rarely about finding the biggest number.
It is about understanding why the numbers are what they are.
Explore current UK property investment opportunities from Residence Index UK and compare each opportunity using more than headline rent.
The ONS figure used above is current as of its July 2026 release: average UK private rent was £1,388 in June 2026, up 3.3% year-on-year. I also verified the cited Residence Index UK articles and current property listings.