
Compare Investment Properties Beyond Price | RIUK
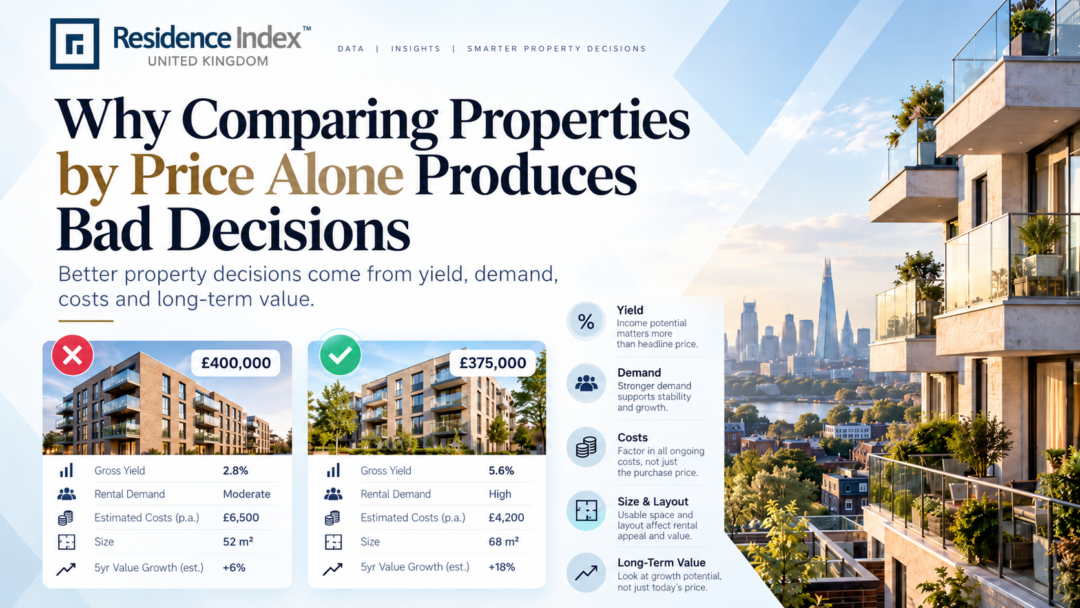
Why Comparing Properties by Price Alone Produces Bad Decisions
When investors compare investment properties, purchase price is often the first number they look at.
Property A costs £200,000.
Property B costs £300,000.
Property A therefore looks cheaper.
But cheaper does not automatically mean better value.
The purchase price tells you how much capital is required to acquire an asset. It does not tell you how efficiently that asset produces income, how expensive it is to own, how resilient its tenant demand may be or how easy it could eventually be to sell.
That distinction matters.
Two properties with very different prices can produce completely different investment outcomes.
A better comparison starts by asking not:
“Which property costs less?”
But:
“What am I getting for the money, what will it cost to hold and what could make it outperform or disappoint?”
Price Is an Input, Not the Investment Case
Purchase price is important.
It affects:
- the deposit required;
- transaction costs;
- financing requirements;
- potential mortgage payments;
- gross yield calculations; and
- the total amount of capital exposed.
But it is only one input.
Consider two hypothetical properties.
Property A
- Purchase price: £200,000
- Expected rent: £1,050 per month
- Annual rent: £12,600
- Gross yield: 6.3%
Property B
- Purchase price: £260,000
- Expected rent: £1,550 per month
- Annual rent: £18,600
- Gross yield: approximately 7.15%
Property A is £60,000 cheaper.
Yet Property B generates considerably more rent and has the stronger headline yield.
That still does not prove Property B is the better investment.
But it immediately demonstrates why comparing price alone can produce the wrong conclusion.
Compare What the Property Produces
The next step is to examine income.
Monthly rent matters, but even that figure can be misleading when used alone.
A larger apartment may produce more rent simply because the investor is buying considerably more floor space.
That is why our guide to Why Investors Should Track Rent per Square Foot explains how rent per square foot can reveal differences that headline monthly rent hides.
Investors might compare:
- monthly rent;
- annual rent;
- rent per square foot;
- rent per bedroom;
- gross yield;
- estimated net yield; and
- rental growth potential.
The objective is not to find whichever property wins one metric.
It is to understand why one asset produces more income than another.
The Cheapest Price per Square Foot May Not Win Either
Price per square foot is useful because it normalises purchase prices across properties of different sizes.
Suppose:
Apartment A
- Price: £250,000
- Size: 500 sq ft
- Price per sq ft: £500
Apartment B
- Price: £300,000
- Size: 750 sq ft
- Price per sq ft: £400
Apartment B costs £50,000 more.
Yet the investor is paying considerably less for every square foot purchased.
That may indicate better value.
Or it may indicate weaker demand, an inferior position within the development, lower specification or another disadvantage.
Metrics help identify the question.
They rarely answer it on their own.
Compare Net Income, Not Just Gross Yield
A property producing an attractive gross yield can still disappoint after operating costs are included.
Those costs may include:
- service charges;
- letting and management fees;
- insurance;
- maintenance;
- repairs;
- void periods;
- compliance expenses;
- furnishing;
- mortgage costs; and
- taxation.
This is especially important when comparing apartments.
A £220,000 apartment with a substantial annual service charge could produce less usable income than a £260,000 alternative with stronger rent and lower relative running costs.
Before accepting a headline yield, investors should therefore understand the costs underneath it.
Our guide to How to Read a Service-Charge Budget Before You Buy explains why service charges should be assessed according to what they provide, their sustainability and their effect on net returns.
The government-backed Leasehold Advisory Service also provides guidance on how service charges work and the rights and obligations attached to them. Read the LEASE service-charge guidance
Look at the Tenant the Property Needs
Two similarly priced properties may rely on very different tenant markets.
One could sit close to:
- major employment;
- universities;
- hospitals;
- transport links;
- business districts; or
- established leisure and retail areas.
Another may appear inexpensive precisely because demand is shallower.
This is why a lower purchase price should never automatically be interpreted as a bargain.
Investors need to understand:
Who is likely to rent this property?
Then:
Why would they choose it over competing accommodation?
And:
How many similar properties will compete for that tenant?
The quality of the demand base can be far more important than a small difference in purchase price.
Current Market Data Shows Why Context Matters
National averages cannot determine whether an individual investment is attractive, but they provide useful context.
The latest Office for National Statistics data available at the time of writing showed average UK private rents rising 3.8% year-on-year to £1,400 in August 2026, while average UK house prices increased 1.4% year-on-year to £273,000 in July 2026.
That difference illustrates an important principle.
Rental markets and property values do not necessarily move at identical speeds.
Investors therefore need to analyse both the income side and the capital-value side rather than assuming purchase price tells the entire story.
View the latest ONS private rent and house price data
Financing Can Reverse the Comparison
Suppose one property costs £50,000 more but produces stronger rent.
Whether that additional purchase price is manageable may depend heavily on financing.
A leveraged investor should consider:
- deposit size;
- loan-to-value;
- mortgage rate;
- arrangement fees;
- monthly interest;
- rental coverage; and
- what happens if borrowing costs rise.
The Prudential Regulation Authority expects relevant lenders assessing buy-to-let affordability to consider whether rental income can support mortgage interest costs through measures including interest coverage ratios.
This matters because the cheapest property is not necessarily the easiest to finance, while the higher-priced property is not necessarily the least affordable.
Income relative to debt matters.
Read the Bank of England guidance on buy-to-let underwriting
Holding Comfortably Matters Too
Some investors accept weak current income because they expect strong future capital growth.
That can work.
But future appreciation cannot pay today’s mortgage, service charge or maintenance bill.
As we discuss in The Capital-Growth Trap: Owning an Asset You Cannot Hold Comfortably, an asset with an attractive long-term story can still become a poor fit if the investor cannot comfortably carry it through difficult periods.
When comparing properties, ask:
Which asset can I realistically hold through a weaker rental market, an unexpected repair or higher borrowing costs?
That question may produce a very different answer from simply choosing the lowest purchase price.
Timing of Cash Flow Matters
Two properties can produce the same annual return on paper while behaving very differently during the year.
One may generate predictable monthly income.
Another may require:
- upfront furnishing;
- completion payments;
- several months before the first tenancy;
- substantial initial service charges; or
- unexpected expenditure soon after completion.
Our article on Property Cash Flow Timing: Why Yield Is Not Enough explains why investors should consider when cash arrives and leaves, not simply the annual percentage shown on a spreadsheet.
An investment needs to work in the real world, not only at year-end.
Compare Exit Liquidity
Investors naturally spend more time thinking about buying than selling.
But the future buyer matters.
Consider two apartments.
One costs less today but appeals primarily to investors attracted by a high advertised yield.
The other costs more but has potential appeal to:
- investors;
- owner-occupiers;
- professionals;
- couples; and
- downsizers.
Which one has the stronger exit market?
There is no universal answer.
But broader resale demand may give an asset greater flexibility when the investor eventually wants to release capital.
Price today should therefore be considered alongside saleability tomorrow.
Amenities Need to Earn Their Keep
Modern developments increasingly offer:
- gyms;
- co-working areas;
- concierge services;
- lounges;
- landscaped spaces;
- roof terraces;
- cinemas; and
- wellness facilities.
These can increase both purchase prices and service charges.
The correct comparison is not:
“Which building has fewer costs?”
It is:
“Do these facilities create enough tenant and resale value to justify their cost?”
In some markets, strong amenities may help a development command premium rent and reduce tenant turnover.
In another location, they may simply add expense.
Value depends on the relationship between the amenity, the target tenant and the cost of providing it.
Use a Proper Property Comparison Framework
Instead of comparing only purchase prices, build a simple comparison table containing:
Metric | Property A | Property B |
Purchase price | ||
Internal floor area | ||
Price per sq ft | ||
Expected monthly rent | ||
Rent per sq ft | ||
Gross yield | ||
Estimated net yield | ||
Service charge | ||
Management costs | ||
Estimated void allowance | ||
Financing cost | ||
Tenant profile | ||
Local rental comparables | ||
Expected completion date | ||
Exit buyer profile | ||
Key investment risk |
Suddenly, the fact that one property costs £30,000 less becomes only one line in a much larger decision.
That is exactly how it should be.
Compare Properties According to Their Portfolio Role
There is one final complication.
The best property for one investor may be completely wrong for another.
An investor seeking maximum current income may favour one asset.
Someone prioritising long-term growth might choose another.
An overseas investor wanting professional management may value operational simplicity.
Another investor may prefer an asset they can manage directly.
Before comparing deals, decide what job the next investment needs to perform.
Our Portfolio Role Test provides a useful framework for doing exactly that.
The Better Question
Instead of asking:
“Which property is cheaper?”
Ask:
“Which property offers the strongest combination of income, costs, demand, financing resilience and exit potential for my strategy?”
That is a harder question.
It is also a much more useful one.
A £200,000 property can be expensive if it produces poor income, requires constant support and is difficult to sell.
A £300,000 property can represent better value if its income, tenant demand and long-term position justify the additional capital.
Price tells you what you pay.
Investment analysis should tell you what you receive in return.
Final Thoughts
Comparing properties by price alone is attractive because it is simple.
Professional investment decisions rarely are.
Look beyond the asking price.
Compare income.
Compare costs.
Compare space.
Compare tenant demand.
Compare financing.
Compare holding risk.
Compare the likely exit.
Most importantly, compare each property against the objective it is supposed to achieve.
You can explore current Residence Index UK properties and assess opportunities using a broader framework than purchase price alone.
For more UK property investment analysis, visit the Residence Index UK blog.
Important: Property investment involves risk. This article is for general information only and does not constitute legal, tax, mortgage or financial advice. Investors should obtain appropriate independent professional advice for their circumstances.